Helpdesk IBM SPSS Statistics 20 Helpdesk IBM SPSS Statistics 20For students from Arnhem Business School | ||||||||
| Home | Codebook | Data | Data editing | Analysis | Graphs | Settings | Links | Methods |
|
Helpdesk IBM SPSS Statistics 20 For students from Arnhem Business School | ||||||||
| Home | Codebook | Data | Data editing | Analysis | Graphs | Settings | Links | Methods |
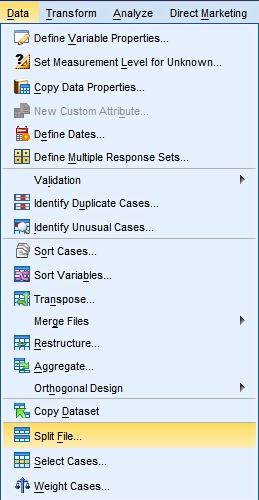
Data Split FileIn our example data file one of the variables indicates the district where the
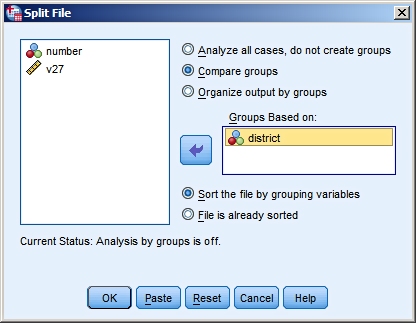
respondents live; a second variable shows the age of the respondents. There is an easy alternative for this by using Split File. It is shown in the example below. Start by opening data_split.sav.
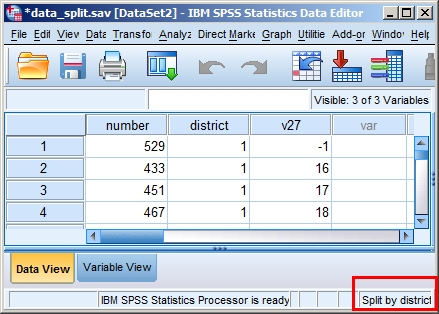
The result is a data set that is sorted by district. Furthermore, on the bottom right of the screen the status bar shows that a splitting of the file is applied (Split by district).
How does the split effect the analyses?
|
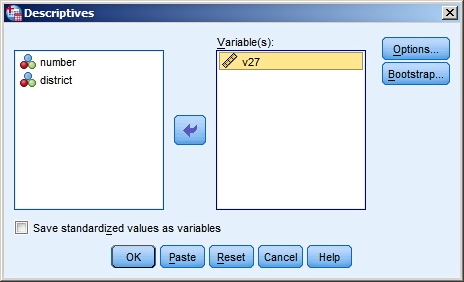
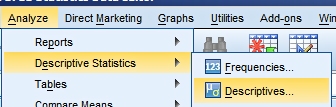 By means of the button  you can select the statistics that you want to
be calculated. We use the default settings.
you can select the statistics that you want to
be calculated. We use the default settings. |
 |
Here is the result:
Note 1: In the output it is clear now that a split of the data has been applied and the values of the selected statistics are shown per district.
Note 2: If you want to return to a single data file with all cases choose Data > Split File and tick the radio button for "Analyze all cases, do not create groups".
![]()
Last modified
30-10-2012
 © Jos Seegers, 2009; English version by Gé Groenewegen. |