Helpdesk IBM SPSS Statistics 20 Helpdesk IBM SPSS Statistics 20For students from Arnhem Business School | ||||||||
| Home | Codebook | Data | Data editing | Analysis | Graphs | Settings | Links | Methods |
|
Helpdesk IBM SPSS Statistics 20 For students from Arnhem Business School | ||||||||
| Home | Codebook | Data | Data editing | Analysis | Graphs | Settings | Links | Methods |
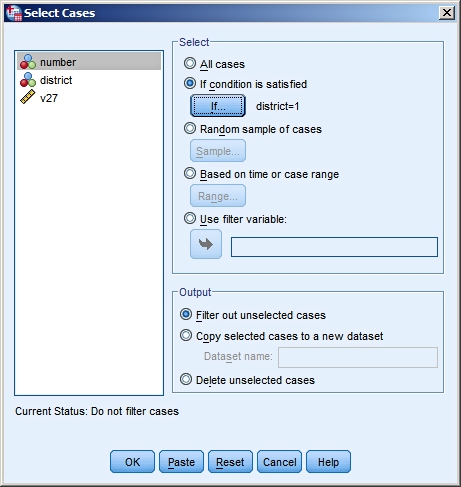
Data Select CasesYou use "Select Cases" if you want to show some results for only a subset of
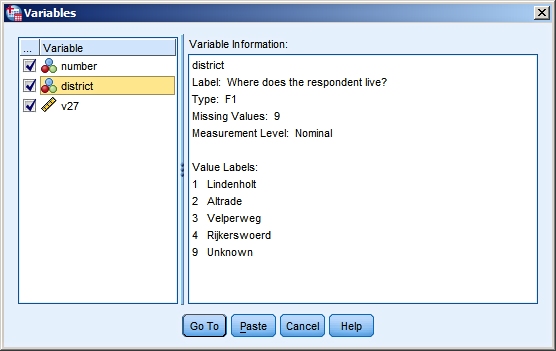
the respondents. If you are interested in the ages of the respondents from the Lindenholt district only then Select Cases is an appropriate tool. We open the data file
data_select.sav and check the value code for the Lindenholt district.
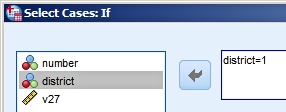
So Lindenholt has value 1. That is the code to use when you select the Lindenholt
district.
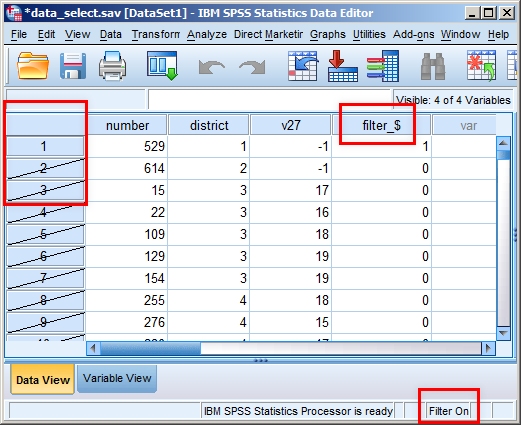
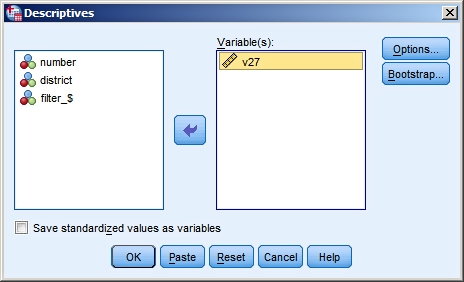
The result:SPSS has created a filter variable (filter_$); it has the value 1 if the
case is selected and the value 0 if the case is not selected.
On the bottom right of the screen the status bar shows that some filtering is applied (Filter On). All analyses that will be conducted from this point forward will only
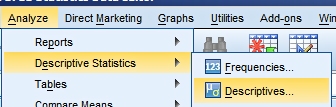
use the data of the cases from the Lindenholt district. For example if we calculate the average age of the respondents:
our result is
This show us that the 192 respondents from Lindenholt are on average 42 years old. Note 1: Be aware that in the output there is no mentioning of an active filtering. So whenever you use a filter you have to pay attention yourself to whether or not it is still active. Note 2: To end the filtering choose Data > Select Cases and tick the radio button for "All cases".
|
Last modified
30-10-2012
 © Jos Seegers, 2009; English version by Gé Groenewegen. |
 .
.