Helpdesk IBM SPSS Statistics 20 Helpdesk IBM SPSS Statistics 20For students from Arnhem Business School | ||||||||
| Home | Codebook | Data | Data editing | Analysis | Graphs | Settings | Links | Methods |
|
Helpdesk IBM SPSS Statistics 20 For students from Arnhem Business School | ||||||||
| Home | Codebook | Data | Data editing | Analysis | Graphs | Settings | Links | Methods |
Data editing Rank CasesUsing Rank Cases one is able to assign rankings to cases. You can use is for example to create a top 10 of cases based on the values of a variable you choose. Example of a question:In our example we have a list of exam grades for a module from quarter 2.
Coding:
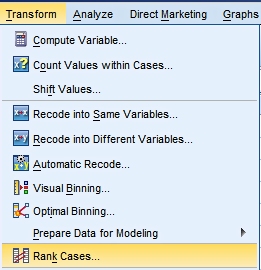
Using Rank Cases:Select from the menu: Transform > Rank Cases; choose the variable to use for Rank Cases.
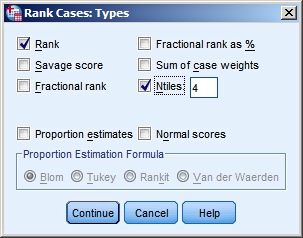
By means of By means of
The result:The output tells us that two new variables have been created:
In the data window we find:
In the picture on the right you can see how the ties for 70 (three
occurences) and 71 (two occurrences) are handled. You can also see that the
first quartile group ends after the grade of 70 and the second one start at the
grade of 71. A frequency table for NGRADE shows us:
Note that the third and fourth groups are of unequal size. This has to do with ties. Equal grades can never be divided over two different Ntile groups. By making a frequency table of the original grades and looking at the cumulative percentages this will become clear.
|
Last modified
30-10-2012
 © Jos Seegers, 2009; English version by Gé Groenewegen. |

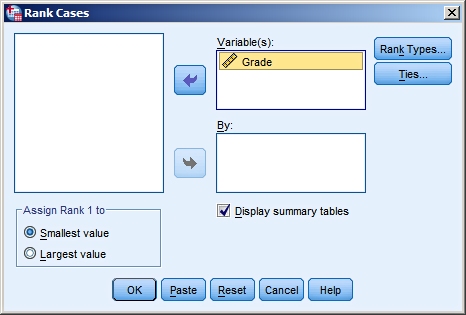
 you can add some options. In this example we have asked for Ntiles, with
parameter 4. This means we want SPSS to split the data in four subgroups of
equal size and indicate in the new variable Ntiles to which subgroup each case
belongs.
you can add some options. In this example we have asked for Ntiles, with
parameter 4. This means we want SPSS to split the data in four subgroups of
equal size and indicate in the new variable Ntiles to which subgroup each case
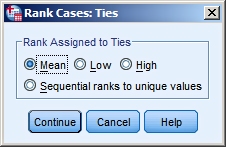
belongs. you can indicate how SPSS should handle ties, i.e. how to rank cases with the
same value for the sorting variable.
you can indicate how SPSS should handle ties, i.e. how to rank cases with the
same value for the sorting variable.