Text Questions
This page contains the following subsections:
Text questions are in general quite diverse. The questions we encounter can
be split up into four main categories. Adding a fifth option "other kinds of
text questions" could make this list complete.
-
Short open questions where the researcher
expects a short answer. Examples are the spontaneous naming of a
product or a typical property of a certain product.
The question "Other, namely ..." also belongs to this category.
-
Somewhat longer open questions where the
researcher asks for a short description.
-
An open question asking for comments in
general. For example in a customer satisfaction survey one could
start with a set of Likert scale questions and end with: "If you
have any additional remarks or comments, please make them here."
-
Open questions in a qualitatitve research
where a huge variety of answers is possible.
and then there is category 5
-
Open questions that don't fit in one of the
categories 1-4.
General outline of the procedure:
-
The complexity of processing the answers
increases from category 1 to 4. Processing answers from
qualitative research is quite hard using SPSS 20. There is
special software for that kind of analysis and one had better
use it. See the Wikipedia article "Computer assisted qualitative
data analysis software" for some options.
-
Processing general remarks and comments
usually will give a large variety of answers. In most cases it
is sufficient to make a list of all the answers. You could for
example use Analyze > Reports
> Case Summaries.
Read this list and use your common sense to find the major
issues. Summarize them. You can cite one or two answers in your
report. Maybe sort the list in some way and then put it in an
appendix.
- The above categories 1 and 2 usually are categorized. Smart
coding in SPSS 20 can help you to formulate and present the
results. Depending on the number of answers and their veriety
you choose one of three options. You code it as:
- a qualitative variable;
- A multiple response question with Dichotomies;
- A multiple response question with Categories.

Classifying answers to open questions into categories is time consuming, even
with specialized software like SPSS Text Analytics.
We will show you in the example below how you can proceed using just SPSS Basic.
We will use the file text_question_1.sav
as our starting point.
Note: The answers in the data file stem from an online
survey, so they have been entered by the respondents. If you have to enter the
data into SPSS yourself (from paper forms) then of course the process will
change, because some of the editing will no longer be necessary and you can
browse through the given answers before the data editing and in this way make a
preliminary list of answer options.
However, the basic idea of categorizing remains.
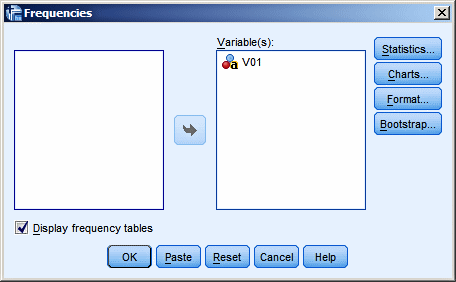
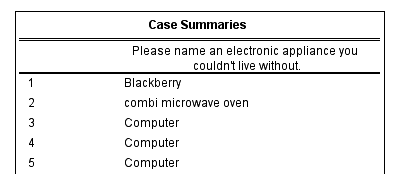
Start by making a frequency table or list with all the answers, using either
Analyze > Descriptive
Statistics > Frequencies or
Analyze > Reports
> Case Summaries:
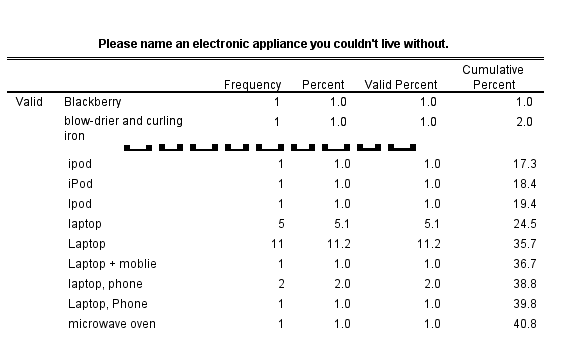
From the output we infer that the 98 respondents gave a total of 45 different
answers, where "different" only means that the string values are different. But
for a human reader some "different" answers are the same, because:
- Due to capitals and lower cast letters strings are
different;
- The same appliance is spelled differently: ipod, iPod and Ipod;
Furthermore:
- Some people gave more than one answer. This is due to a
slightly ambiguous phrasing of the question. Apparently "Name an
electronic appliance" doesn't stress enough that we want exactly
one appliance.
How to process these multiple response answers is up to the
researcher. For example he or she could decide to use the first
device mentioned and to ignore the rest of the answer.
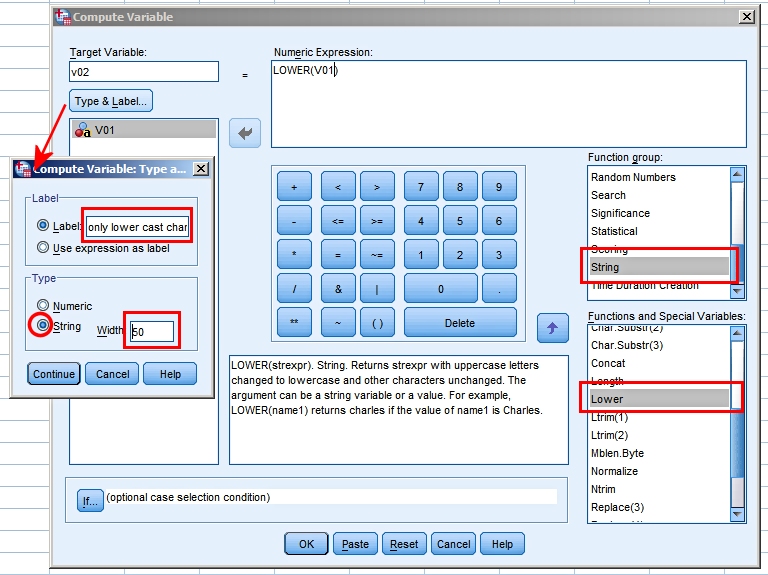
We will continue by recoding the answers into a single qualitative variable.
We can use the Compute command to do this (from the menu:
Transform > Compute
Variable...).
The screen dump below shows how it
can be done using the string function Lower. We compute a new string variable
V02 from the existing string variable V01.
Try it out yourself. Our
intermediate result is the file text_question_2.sav.
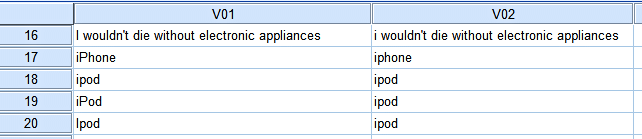
This reduces the number of different answer options to 35. It is a first
small improvement.
And it will pay off again in step 4, when we will use Recode.
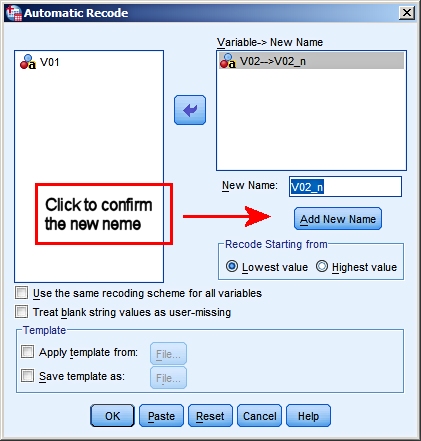
The next step is transforming V02 into a numeric variable using Automatic Recode.
The reason is that processing numeric variables is a lot faster and is better
usable in SPSS. And you can easily combine numeric values into a group, while
for strings that is not so easy.
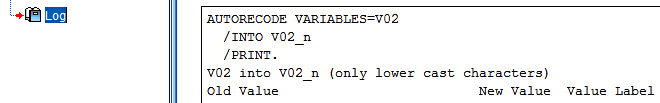
Now study the LOG in the output.
Below you see a complete overview of al the answers given:

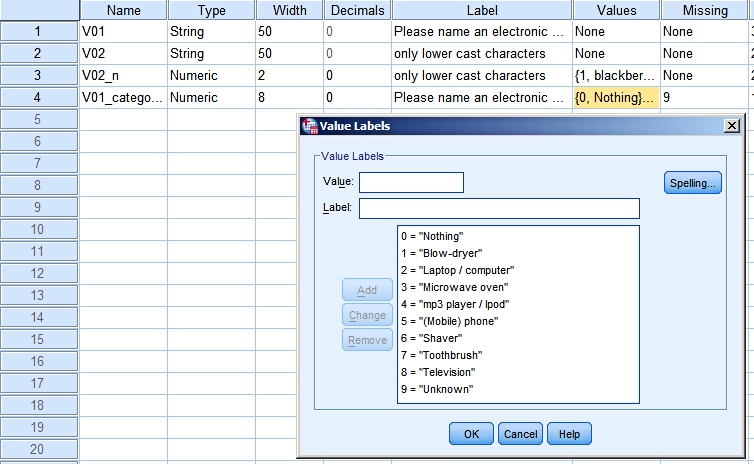
After studying this list I came to the categories shown
below. To implement this I will have to make a new variable
(again) with these values and value labels.
Furthermore, I will have
to recode the current variable V02_n into this new one.
|
Value |
Value Labels |
| 0 |
Nothing |
| 1 |
Blow-dryer |
| 2 |
laptop / computer |
| 3 |
microwave oven |
| 4 |
mp3 player / Ipod |
| 5 |
(mobile) phone |
| 6 |
shaver |
| 7 |
toothbrush |
| 8 |
television |
| 9 |
unknown
(Missing Value) |
The answers for variable V02_n form the starting point for the creation of
the new variable.
We will call it "V01_categories". It helps the recoding to show it
in a well-organized table.
You can also print the long list of answer codes from above and write the target
value for the new recoded variable next to it.
Remember our earlier decision that we will only record
the first answer given by a respondent. If you decide
otherwise, then you will have to create four copies of the
variable "V01_categories", all with the same 10 coded
categories. The second, third and once even the fourth
appliance mentioned will be recorded in the 2nd, 3th and 4th
copy of V01_categories.
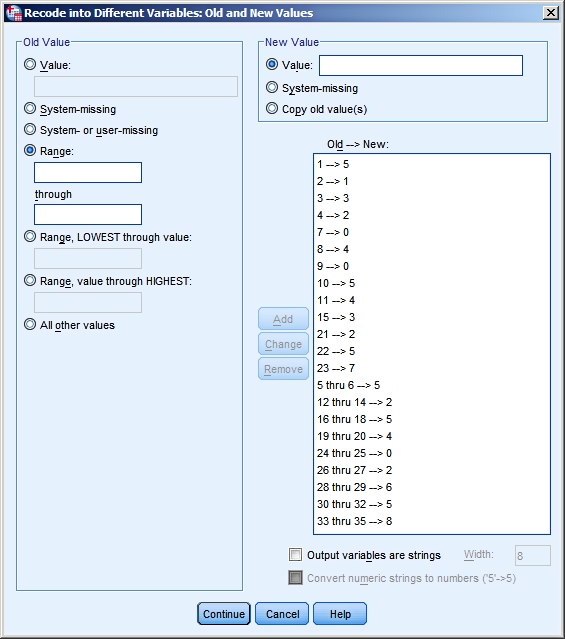
We have:
| Value V02_n |
New |
Value V02_n |
New |
Value V02_n |
New |
Value V02_n |
New |
| 1 |
5 |
11 |
4 |
21 |
2 |
31 |
5 |
| 2 |
1 |
12 |
2 |
22 |
5 |
32 |
5 |
| 3 |
3 |
13 |
2 |
23 |
7 |
33 |
8 |
| 4 |
2 |
14 |
2 |
24 |
0 |
34 |
8 |
| 5 |
5 |
15 |
3 |
25 |
0 |
35 |
8 |
| 6 |
5 |
16 |
5 |
26 |
2 |
|
|
| 7 |
0 |
17 |
5 |
27 |
2 |
|
|
| 8 |
4 |
18 |
5 |
28 |
6 |
|
|
| 9 |
0 |
19 |
4 |
29 |
6 |
|
|
| 10 |
5 |
20 |
4 |
30 |
5 |
|
|
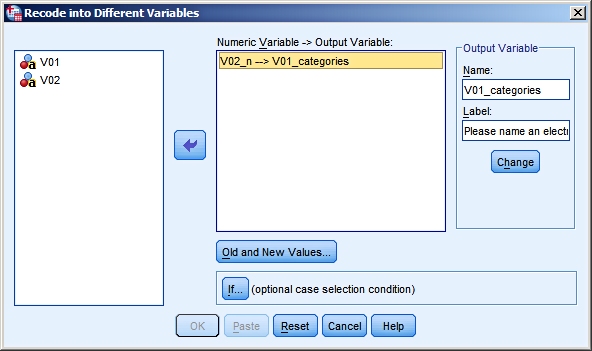
Implementing this in SPSS uses Recode into Different Variables (from the
menu Transform > Recode
into Different Variables...):
Once all recodings from old to new values have been defined, it looks like
this:
Next we add the value labels to the newly created variable and we define 9
as its missing value:
This final data file can be found as
text_question_4.sav.
Finally we can give an overview (tabular or graphical) of the answers to the
open question we started with:
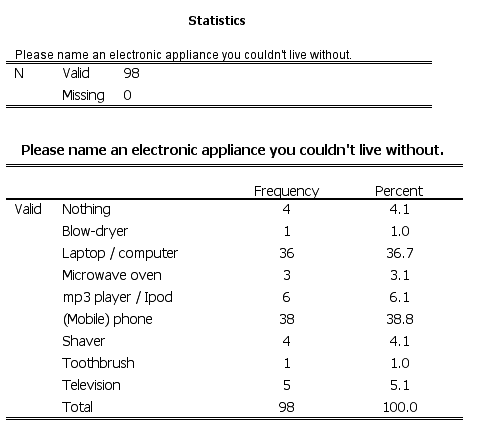
- As you can see all 98 respondents have their first answer
coded. Nobody skipped the question.
- Two answers stand out. (Laptop / computer and (mobile)
phone). All other options have been mentioned by just a few
people. To summarize our findings we could combine them into a
third group "other appliances".
- This coding process is quite time consuming. But if you want
to make crosstabulations or compare groups in other ways, it is
a necessary step. Whether it is worth the effort is to a large
extend determined by the research questions that you formulated
at the start of the research.
- If you want to avoid this coding process, then you have to
think ahaead when you set up and pretest your questionnaire.
Meaybe you should make the question more precise or give the
respondents a predefined list of options. But of course that
would change the nature of the question.
- Realize the difference between an open question with an
answer field for a short answer (a spontaneous reaction by the
respondent) and a question with a list of options given (a
helped response). Which option is the best for your research
depends on the research question(s) you hope to answer. And you
have to balance the costs of the lenghty coding process versus
the benefits of more spontaneous responses from your
respondents.
We used the website: www.wordle.net to
create the visual display of our table.
Note that in order to get it we had to adjust some of the labels.
The font size of each word is proportional to the frequency in the table
above.
Please name an electronic
appliance you couldn't live without.

Source: Research IB&C, 8 April 2010, by Jos Seegers.
|  Helpdesk IBM SPSS Statistics 20