Helpdesk IBM SPSS Statistics 20 Helpdesk IBM SPSS Statistics 20For students from Arnhem Business School | ||||||||
| Home | Codebook | Data | Data editing | Analysis | Graphs | Settings | Links | Methods |
|
Helpdesk IBM SPSS Statistics 20 For students from Arnhem Business School | ||||||||
| Home | Codebook | Data | Data editing | Analysis | Graphs | Settings | Links | Methods |
Analysis Multiple response question (dichotomies)Multiple response refers to the situation where people are allowed to tick
more than one answer option for a question.
The question
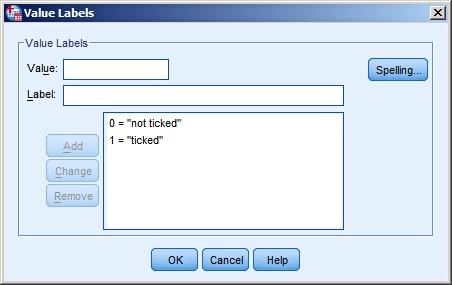
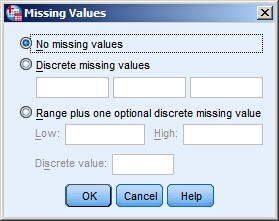
Coding in SPSS
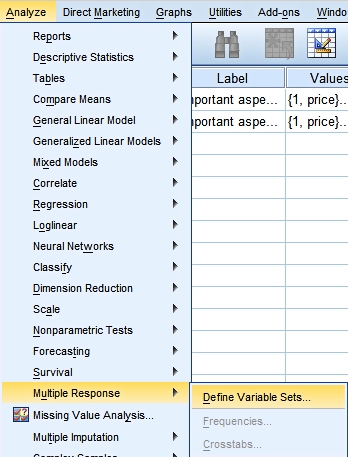
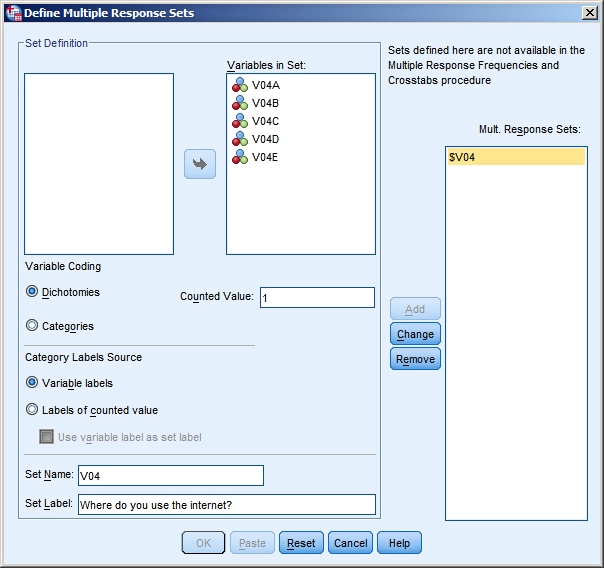
Creating a frequency table for multiple response items (method 1)
Please pay attention to the note in the definition window. This definition
can only be used for the Analyse > Multiple Response method.
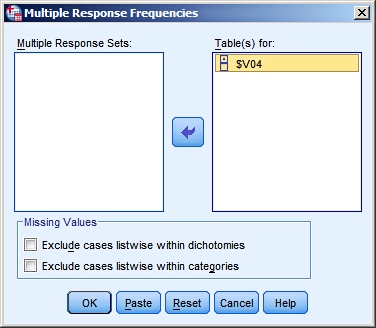
The result of method 1:We have edited the frequency table only a little. Here you see it together with some info about the cases.
Interpreting the output
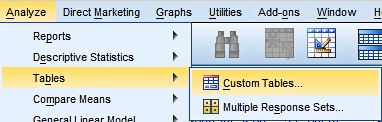
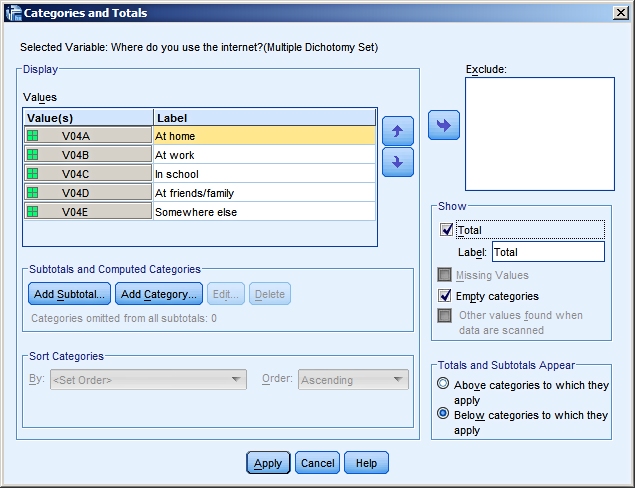
Creating a frequency table for multiple response items (method 2)This time we use the Data menu to define the multiple response set.
Once we have defined the multiple response set we can use it.
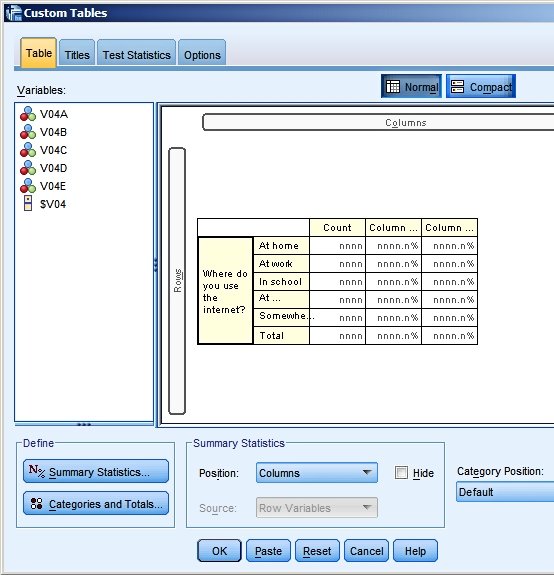
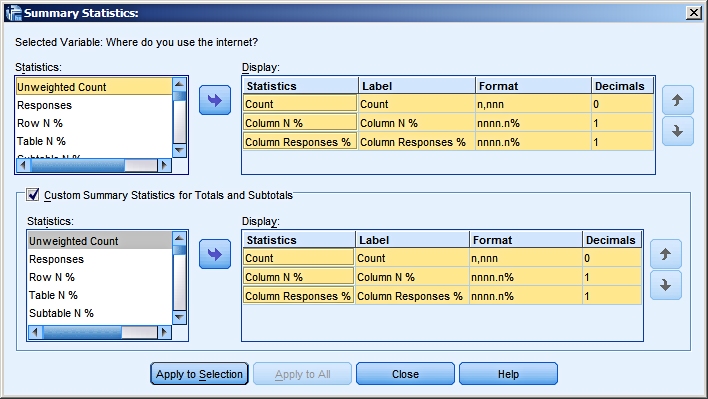
We have chosen for the following options:
The result of method 2:
Note that the totals that are reported here are different from the ones of
method 1. Note: Custom tables offers you a lot of options with respect
to the content and the layout of the table, far more
than method 1 does.
|
Last modified
30-10-2012
 © Jos Seegers, 2009; English version by Gé Groenewegen. |