Helpdesk IBM SPSS Statistics 20 Helpdesk IBM SPSS Statistics 20METHODS | |||||||
| Introduction | Sample size | Table design | Graph design | Syntax | Testing | Links | SPSS Statistics 20 |
|
Helpdesk IBM SPSS Statistics 20 METHODS | |||||||
| Introduction | Sample size | Table design | Graph design | Syntax | Testing | Links | SPSS Statistics 20 |
Testing A basic exampleOn this page you find an example in which step by step the basic procedure
for testing of hypotheses is explained.
An exampleSomewhere in the world there is a national railway company that states it
complies with government targets. The target is that at least 90% of all trains
arrive in time. A consumer organization of rail travellers disputes this. They
claim the target is not met and less than 90% of all trains arrive in time.
Suppose that by the end of the research we would have found that 89.9% of the trains in the research were on time. It is below 90% but would we have a case against the railway company? Not really. We are dealing with a sample from a larger population. As we all know there are random fluctuations that most likely cause the sample result to deviate from the true population value. With this result of 89.9% the consumer organization has insufficient evidence to back up their claim. The situation would be completely different if the research showed only 10% of the trains to be on time. Then everyone would consider this as clear evidence that the railway company totally fails to meet its punctuality targets. Let us assume that in this example the company found 880 trains out of 1000 to be on time. Is this the proof we are looking for our claim or does the railway company go free due to lack of evidence? Is the sample result something or nothing at all?
Specifying the problemTesting of hypotheses follows a fixed pattern of
steps from specifying the problem to the final conclusion.
It always starts with a description of the property of the
population that is disputed. In our example the discussion is about p, the population proportion of all scheduled trains that arrive in time.
HypothesesThe alternative hypothesis HA specifies the claim we seek to prove. The
null
hypothesis H0 is the initial belief, stating the status quo, or in this case
stating that the company is doing a decent job. H0: p ≥ 0,9
Test design and test statisticNow we have to set up our research. We specify what and how we will measure. These measurements will be summed up in a single number, the test statistic T. In this example we choose T = The number of trains that arrive in time from our random sample of 1000.
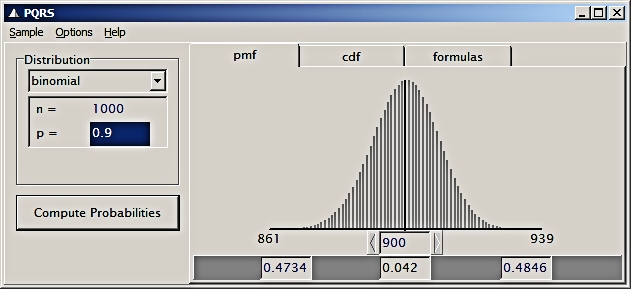
Distribution as predicted by the null nulhypothesisGiven the setup of randomly selected trains and the specifications of H0 we know that T follows a binomial distribution with as parameters n=1000 and p=0.90 (we use the boundary of the range specified by the null hypothesis). This binomial distribution is well-known; it looks like
this: As we can see the probability that the railway company meets its targets but that we nonetheless find fewer than 900 trains arriving on time is 0.4734. The distribution shows the expected average but also the variability that we may expect due to sampling. It also shows that only 861 trains
arriving on time (the lower end of the scale in the picture) would be a very unlikely outcome in
combination with H0.
So the question is: When do we conclude that we have found
something, that we have proof against the railway company, and when do we have to concede that there is
nothing at all going on, that there is insufficient evidence
against the railway company ?
Significance of the sampling resultAs stated in the introduction we found as value of our test statistic: T = 880. First of all we remark that the test result is consistent with HA. The sample results shows a punctuality that is indeed below 90%. To answer this we calculate the significance that goes
with the sample result. That means we calculate the
probability of T = 880 or even more extreme, given the
distribution based on the null hypothesis. So we need P( T ≤
880 | Bin(n=1000 and p=0.90) ). P( T ≤ 880 ) = 0.022.
ConclusionSmall probabilities cast doubt on our null hypothesis. Its predictions
combined with the survey data lead to an very unlikely situation. This is the
evidence we were looking for. In plain English this means: Our research shows that the punctuality of the railway company is not good enough. It is below the target value of 90% (with sign. = 0.022).
Significance levelsThe example above shows us that the choice between "stick to H0" and "reject H0, choose HA" is based on a probability, the significance of the test result. The smaller it gets, the more convincing our evidence is. But when is it small enough? Here are some guidelines:
In marketing research the default setting is that when
the significance drops below 0.05 we will reject the null
hypothesis.
|
Last modified
30-10-2012
 © Jos Seegers, 2009; English version by Gé Groenewegen. |