Helpdesk IBM SPSS Statistics 20 Helpdesk IBM SPSS Statistics 20For students from Arnhem Business School | ||||||||
| Home | Codebook | Data | Data editing | Analysis | Graphs | Settings | Links | Methods |
|
Helpdesk IBM SPSS Statistics 20 For students from Arnhem Business School | ||||||||
| Home | Codebook | Data | Data editing | Analysis | Graphs | Settings | Links | Methods |
Analysis Chi-square Test for a CrosstabulationBy means of a chi-square test for a crosstabulation you test whether there exists a relationship between two variables or whether there are differences between groups with respect to a measured variable. On this page we show you how to perform the chi-square test and also how to visualize the result. The presentation takes the following steps:
Note: In the section on testing you find some explananation of the method and way of thinking for testing of hypotheses. Hypotheses:In a number of districts in both Arnhem and Nijmegen
research was done regarding the internet use of the people
there (data from Spring 2004). H0: There are no differences between the districts regarding the
internet use.
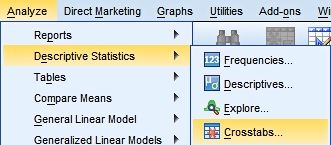
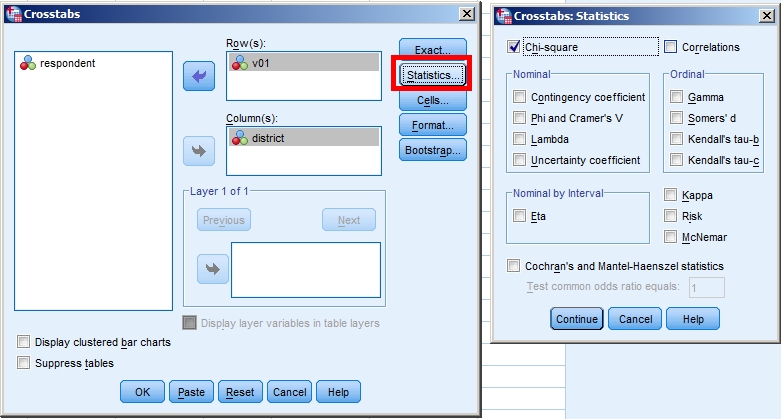
Asking for the test using SPSSWe make a crosstabulation of the two variables involved. Next we click the
"Statistics..." button and tick the box for Chi-square.
The SPSS output
Checking the chi-square conditionsIn order for a chi-square test to give reliable results the crosstabulation has to satisfy certain conditions. They are:
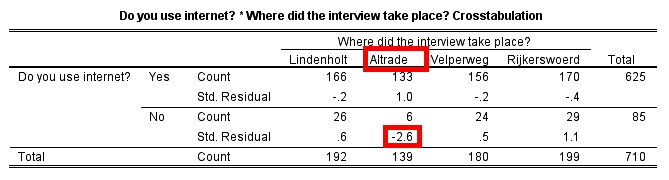
These conditions are reported by SPSS as a footnote in the chi-square output. In our example we find:
Hence both conditions are satisfied and a chi-square test is valid for our crosstabulation. Note: If the conditions are not
satisfied one might adjust the crosstabulation by either
combining some of the rows or columns in a logical way or by
deleting some rows or columns that cause this problem (as
long as this can be justified).
Interpreting the outputThe "Pearsons Chi-square" has a significance of 0.021. Hence we can reject the null hypothesis with a
significance of 0.021.
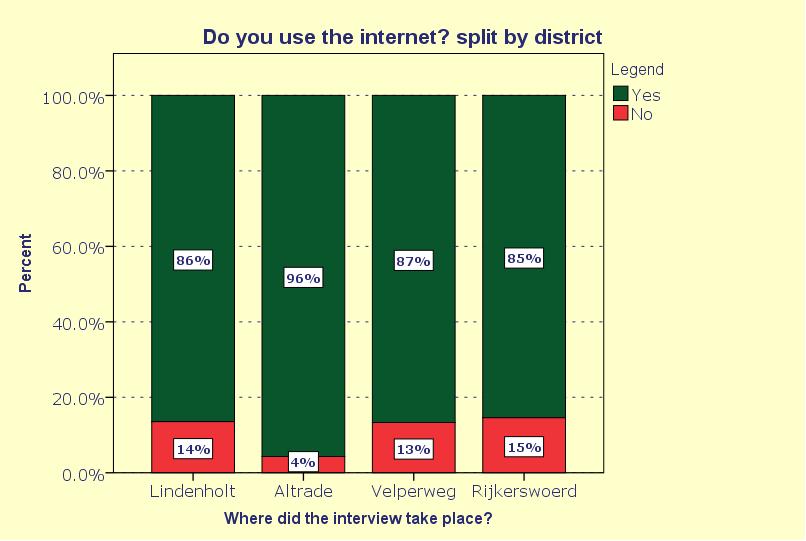
Post-hoc analysisWe have established that there are differences between the districts. The logical next question is: What exactly are these differences?
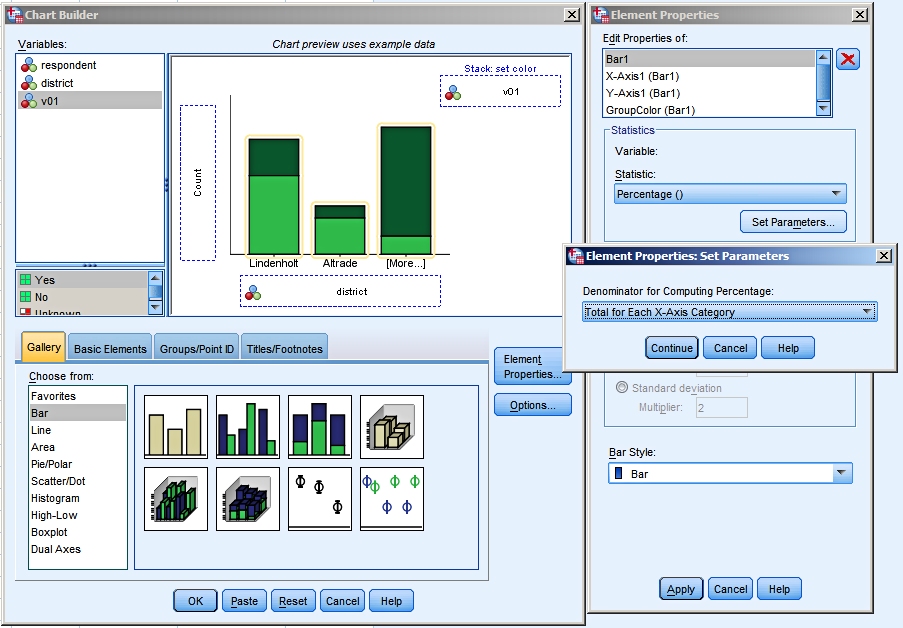
Answer 2: Use a stacked bar chart to visualize the differences. We obtain a stacked bar chart through the Chart Builder.
We put the districts on the X-axis and use V01 to determine
the stacks.
|
Last modified
30-10-2012
 © Jos Seegers, 2009; English version by Gé Groenewegen. |