Helpdesk IBM SPSS Statistics 20 Helpdesk IBM SPSS Statistics 20For students from Arnhem Business School | ||||||||
| Home | Codebook | Data | Data editing | Analysis | Graphs | Settings | Links | Methods |
|
Helpdesk IBM SPSS Statistics 20 For students from Arnhem Business School | ||||||||
| Home | Codebook | Data | Data editing | Analysis | Graphs | Settings | Links | Methods |
Graphs Bar chart for multiple response questions (dichotomies)Elsewhere on this site we discussed how to make a table for the situation
described in the title. You find it at
Analysis Multiple response question (dichotomies).
The questions:
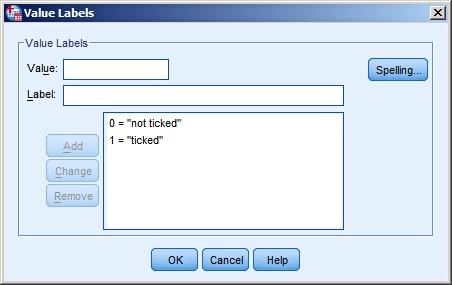
Coding in SPSS:
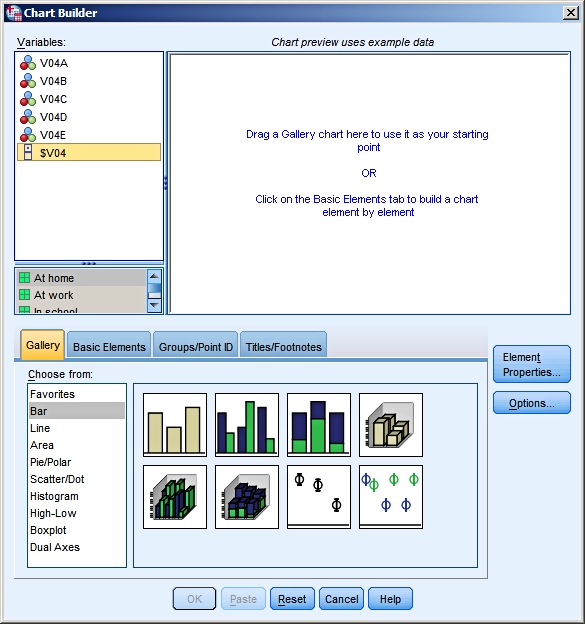
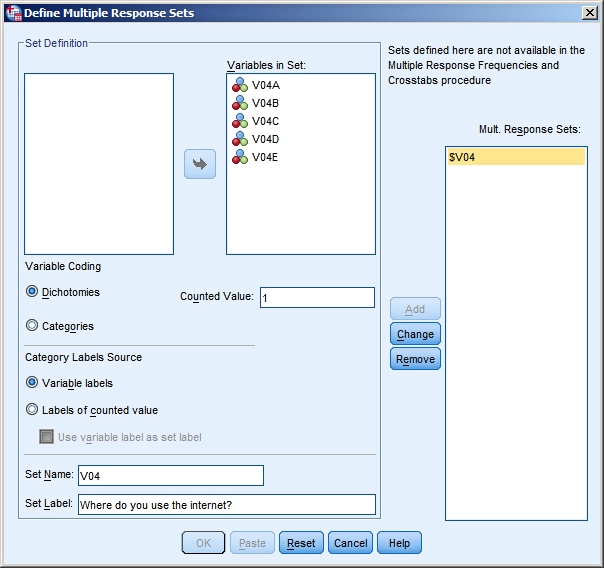
Creating a Multiple Response SetFirst you have to specify which variables belong to the multiple response group. Use Data > Define Multiple Response Sets... to do so.
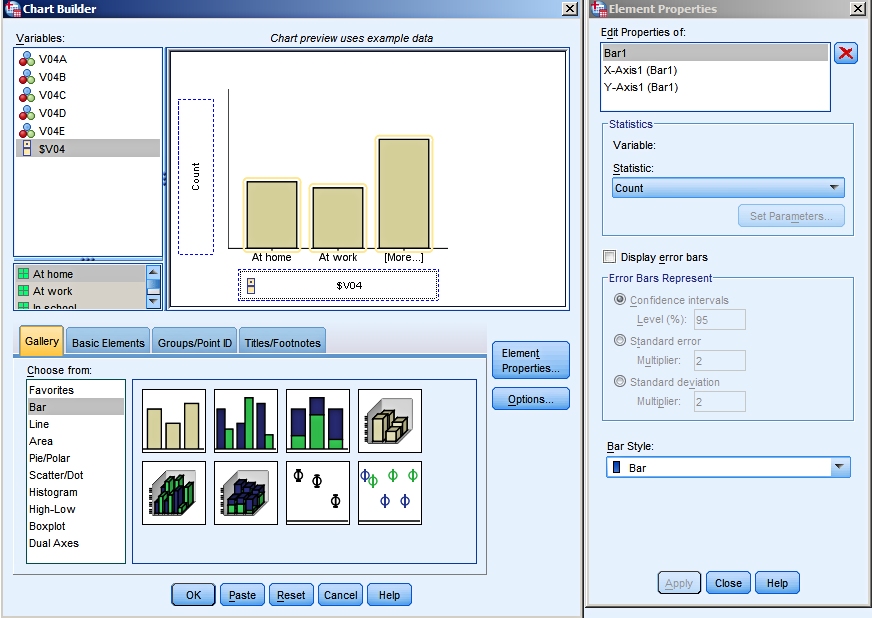
Creating the bar chart
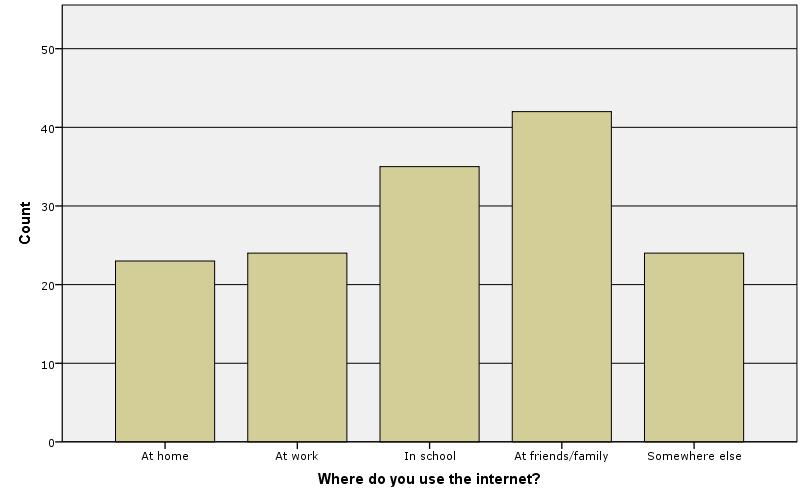
The first result
Clearly this graph needs editing. A title is missing. Depending on the
context where it will be published it might need a source.
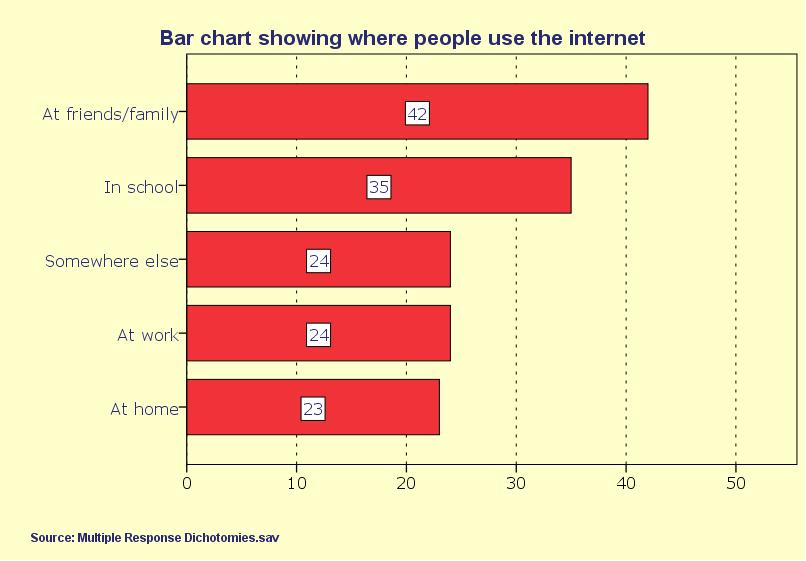
The edited graph
|
Last modified
30-10-2012
 © Jos Seegers, 2009; English version by Gé Groenewegen. |

 .
.