Helpdesk IBM SPSS Statistics 20 Helpdesk IBM SPSS Statistics 20For students from Arnhem Business School | ||||||||
| Home | Codebook | Data | Data editing | Analysis | Graphs | Settings | Links | Methods |
|
Helpdesk IBM SPSS Statistics 20 For students from Arnhem Business School | ||||||||
| Home | Codebook | Data | Data editing | Analysis | Graphs | Settings | Links | Methods |
GraphsOn our site we show you a number of examples how to create and edit graphs
for your data using SPSS 20. There are countless graphs possible. We have made a selection of examples. See below for some general warnings related to the Chart Builder. Examples of charts
Please note that many graphs can be created in more than one way. If you open the Graphs menu you find three main entries:
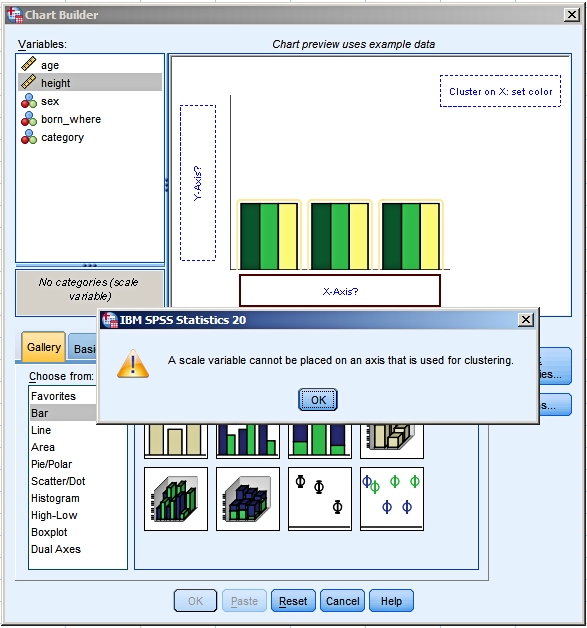
In our examples we will focus mostly on Chart Builder. But we will also use Legacy Dialogs from time to time. Some warnings related to the Chart Builder.In the SPSS data file (Variable View Tab) the measurement
level of each variable can be set at nominal, ordinal or
scale. This is used by the Chart Builder to assist you in
building your chart. It prohibits the use of variables with
an incorrect level of measurement in your charts.
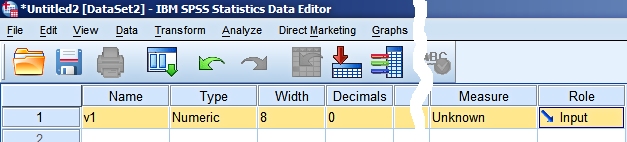
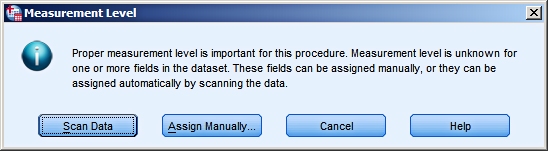
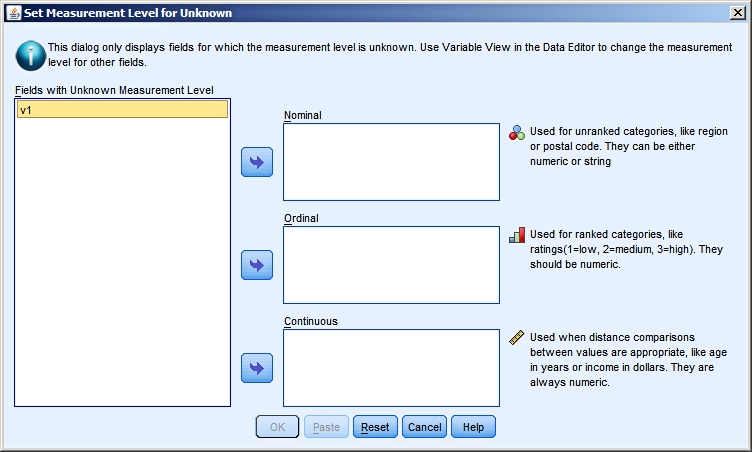
It is possible to define variables in your data file, without specifying their level of measurement.
In this situation Chart Builder warns you and won't open
until you have done something about it. If you choose for the "Scan
Data" option SPSS will look at the data that are entered for
variable V1 and will choose the level of measurement that
seems most appropriate.
Only after solving the problem of the unknown measurement levels will Chart Builder proceed and open its dialog window.
Further questions?You can ask them by means of our question form. |
Last modified
30-10-2012
 © Jos Seegers, 2009; English version by Gé Groenewegen. |