Helpdesk IBM SPSS Statistics 20 Helpdesk IBM SPSS Statistics 20For students from Arnhem Business School | ||||||||
| Home | Codebook | Data | Data editing | Analysis | Graphs | Settings | Links | Methods |
|
Helpdesk IBM SPSS Statistics 20 For students from Arnhem Business School | ||||||||
| Home | Codebook | Data | Data editing | Analysis | Graphs | Settings | Links | Methods |
Data Sort CasesLooking at your raw data to see what it seems to say is useful in exploratory
data analysis. You use "Sort Cases" if you want to order your data based on the values of one
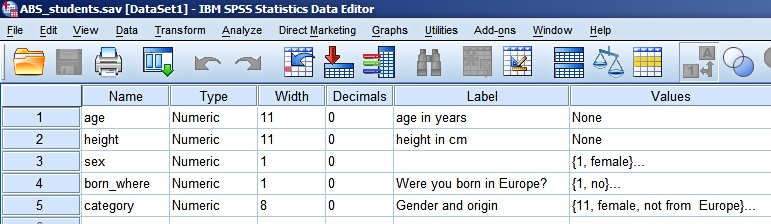
or more variables in your file. An example of sortingFor a number of years we have asked foundation year students from Arnhem Business School to fill in a simple questionnaire with some questions about who they are. We use this data in class in our introductory statistics course. The following information is collected in the file (see abs_students.sav):
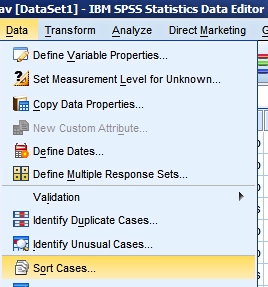
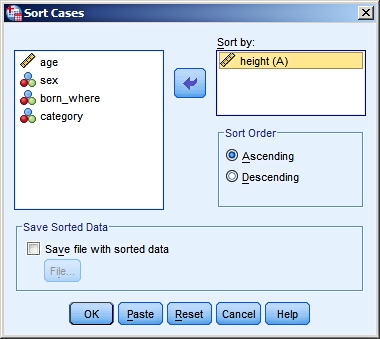
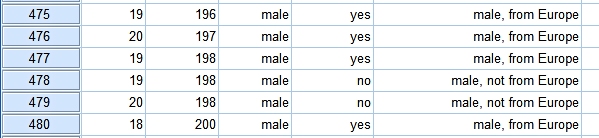
In our sorting example we will order our data set by height of the students. Choose from the menu Data > Sort:
If you select several variables for the sorting process, the
data is first sorted by the variable at the top of the list,
and next the cases with the same value for this first
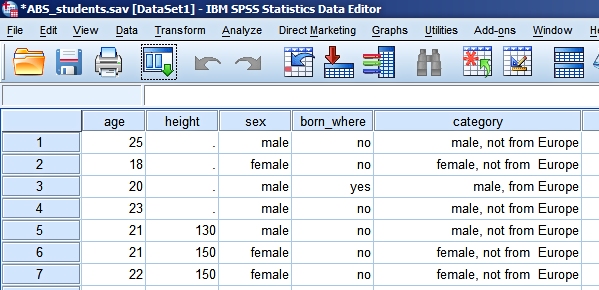
variable will be sorted by the second variable. The result of sorting by height:
We see four students for which the height is unknown. Their
cells for "height" are empty, denoted by (.), which
represents a system missing value.
First of all you have to answer the question "Do I trust
this data?". Case number 6 is a female, not born in Europe, who is 150 cm tall. There is nothing strange about this case. At the bottom of the file we find the tall guys in our dataset. Nobody seems to be exceptionally tall.
|
Last modified
30-10-2012
 © Jos Seegers, 2009; English version by Gé Groenewegen. |